


 Expands Exclusive Partnership With PhonePe")


 Expands Vehicle Service")


After recording some improvement in recent years, India’s notoriously low female labour force participation rate (LFPR) seems to have stagnated, data from the Periodic Labour Force Survey (PLFS July 2021-June 2022) shows. 29.4% of women (aged 15-59) were part of India’s labour force in 2021-22, as compared to 29.8% in the preceding year. In contrast, men’s LFPR improved from 80.1% in 2020-21 to 80.7% in 2021-22.
Figure 1

These numbers reflect the labour force participation rate (LFPR) based on current weekly status (CWS). An individual is considered to be a part of the labour force by current weekly status if they were either employed (or looking for work (unemployed)) for at least one hour on at least one day in the week preceding the survey.
The conspicuously low share of women in the labour force is not a new trend. India has historically reported low FLFPR, which started declining soon after the turn of the millennium.
The cyclical nature of women’s work
However, in recent years, women’s LFPR saw some improvement. In 2017-18, 22.9% of women aged 15-59 were part of the labour force. This improved to 23.4% in 2018-19, and saw a jump of nearly 5 percentage points in 2019-20. This period corresponds to July 2019 to June 2020, and includes the initial months of the Covid-19 pandemic when India was under a stringent lockdown brought in to check the spread of the new virus.
Research evidence indicates that even where women’s participation in the labour force is low, it often increases during times of crisis, indicating its counter-cyclical nature. In the 1999-2000 to 2004-05 period in India, for example, women’s participation in the labour force increased to supplement falling incomes in response to distress conditions in agriculture (Abraham, 2009). In their research, Mehrotra et al (2014) found that a large part (18 of 60 million, i.e. roughly 30%) of this increase in employment was due to rural women joining the workforce as self-employed workers in agriculture. In contrast, women quit agriculture in the high growth period of 2003-04 to 2011-12, but without an accompanying increase in non-farm employment, women’s overall LFPR fell in this period.
More recently, in their research investigating the links between pandemic income shocks and FLFPR, Ishaan Bansal and Kanika Mahajan (2021) had found that the probability of women’s employment increased in households that experienced sharp negative income shocks induced by the pandemic-related lockdowns in India. However, this improvement in women’s employment was only transitory in nature, and women’s employment started to decline once the economic situation of households improved, they found, underscoring that women’s labour often acts as an insurance during low-income periods for poorer households.
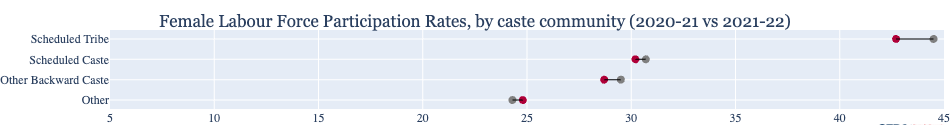
After increasing for another year, in 2021-22, the improving trend seems to have been arrested (Figure 1). However, the changes haven’t been homogenous for all women – in 2021-22, the LFPR saw small dips for rural women, women from Scheduled Tribe, Scheduled Caste, and Other Backward Class communities, as well as women who were illiterate or had primary-to-middle level of education. On the other hand, the LFPR among urban women, women with graduate (or higher) level education, or who were illiterate saw a marginal improvement between 2020-21 and 2021-22. (Figure 2)
Figure 2


 Ongoing shifts in women’s work in India
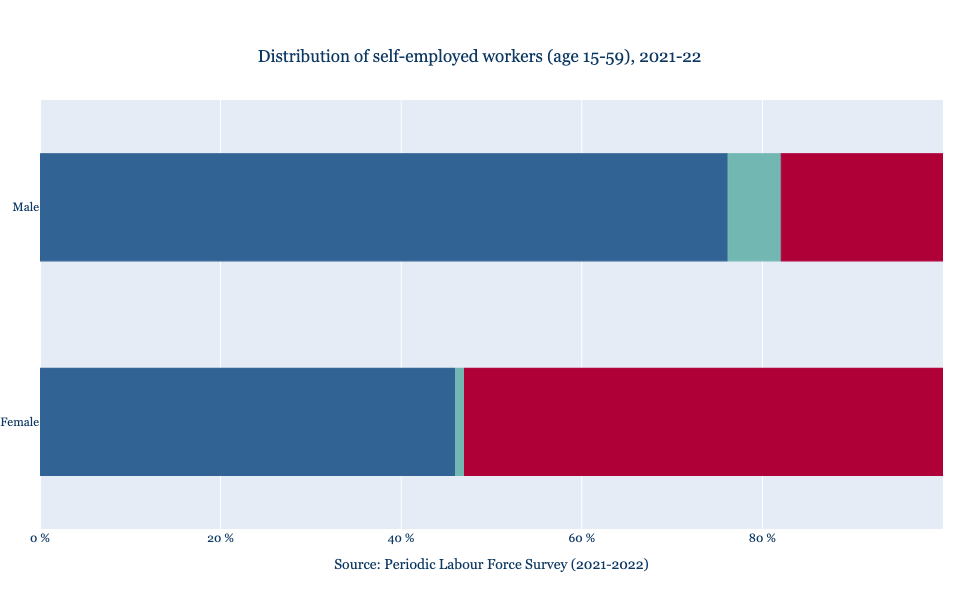
Sixty percent of women (aged 15-59) who were working in India in 2021-22 were self-employed, the PLFS data shows. Among men, the corresponding share was 50.9% (Figure 3).
Figure 3

Self-employment includes a diverse set of individuals – from those who own a business with hired labour, to those who operate enterprises without any hired workers. It encompasses all individuals who do not work under a fixed contract and salary. Individuals may be self-employed because of a range of factors – this could be an aspirational choice but could also be a way to find work when one is not able to find wage or salaried employment.
“Self-employed” includes those who are own-account workers, employers or unpaid helpers. Among women who were self-employed in 2021-22, more than half (53%) worked as “unpaid helpers” and 44.5% were working as “own account workers” (those who operate their own enterprises without hiring any labour). Only 1% among those self-employed employed others in their enterprise. In comparison, of the men (aged 15-59) who were self-employed in 2021-22, 74.3% were own account workers, 5.9% were employers, and only 17.9% worked as unpaid helpers (Figure 4).
Figure 4
Working as an unpaid helper in a family-owned enterprise is a particularly inferior form of work – as it does not lead to independent income or increase women’s participation in the public sphere (Mehrotra, 2014). As Deshpande (2021) notes, much of the work undertaken by such workers includes “bottom-of-the-rung, survivalist livelihood activities”.
In 2017-18, 48% of women (aged 15-59) were self-employed, a proportion similar to that of men (48.9%), but this proportion has grown over the last four years. A similar growth has not occurred among male workers. And among women, this increase in self-employment has been driven largely by rural areas (Figure 5).
Figure 5

Similarly, among men and women of different age groups, women aged 15-19 were most likely to be self-employed and also most likely to work as unpaid helpers. In fact, in 2021-22, half (50.8%) of all women in this age group worked as unpaid helpers in 2021-22, up from 37.9% in 2017-18. Men above 30 years were the least likely to be working as unpaid helpers (4.4%).
Figure 6


